An in-depth exploration of signal-related knowledge.
The Fourier Transform
1. Why can the Fourier transform convert between the time domain ⇄ frequency domain?
Because it is based on the following assumption (or rather, fact):
Any signal (as long as it satisfies certain conditions) can be viewed as a superposition of sine and cosine waves of different frequencies.
The Fourier transform is simply a projection operation:
- Project the signal onto a series of sine/cosine (or complex exponential) “basis” functions
- The resulting projection coefficients are the magnitude and phase of each frequency component
In essence it is the same idea as “decomposing a vector onto a basis”, except that:
- The basis for vector decomposition is
- The basis for signal decomposition is
2. The simplest possible example
Suppose we have a time-domain signal:
The unit is seconds and the sampling rate is high enough. It is simply a pure 3 Hz sine wave.
Step 1 — Define the frequency basis
We assume the signal may contain components from 0 Hz to 10 Hz, each of the form:
(A complex exponential is equivalent to sine + cosine.)
Step 2 — Project onto each frequency
The Fourier transform formula:
We multiply
Step 3 — Obtain the spectrum
- When
Hz: and the basis function have exactly the same frequency and phase, so the integral yields a very large value (maximum projection). - When
Hz:
the integral involves a lot of cancellation between positive and negative parts (because the peaks and troughs do not line up), so the result is close to 0.
So we get:
This is the frequency-domain signal — it tells you:
“This signal contains only a 3 Hz component, with such-and-such amplitude and such-and-such initial phase.”
3. The underlying mathematical essence
The essence of the Fourier transform is:
- Orthogonality of the basis functions: sines/cosines of different frequencies are orthogonal (their integral inner product is 0).
- The transform is an inner product / projection: the integral computes the projection coefficient of the signal along each basis direction.
- The frequency domain is just the collection of these projection coefficients.
Analogy:
- Time domain: describes the waveform of the signal as it changes over time.
- Frequency domain: describes which “frequency basis functions” the signal is composed of, and the magnitude and phase of each component.
4. Deeper implications
- The time domain captures local features; the frequency domain captures global features:
a sine wave may look like mere oscillation in the time domain, but in the frequency domain it is a single point. - Energy conservation (Parseval’s theorem): the energy of the time-domain signal = the energy of the frequency-domain signal.
- Linear transform: the Fourier transform is a linear operator, so the superposition principle holds.
- Change of basis: it is really just switching from the “time basis” to the “frequency basis”.
5. Examples of the Fourier transform
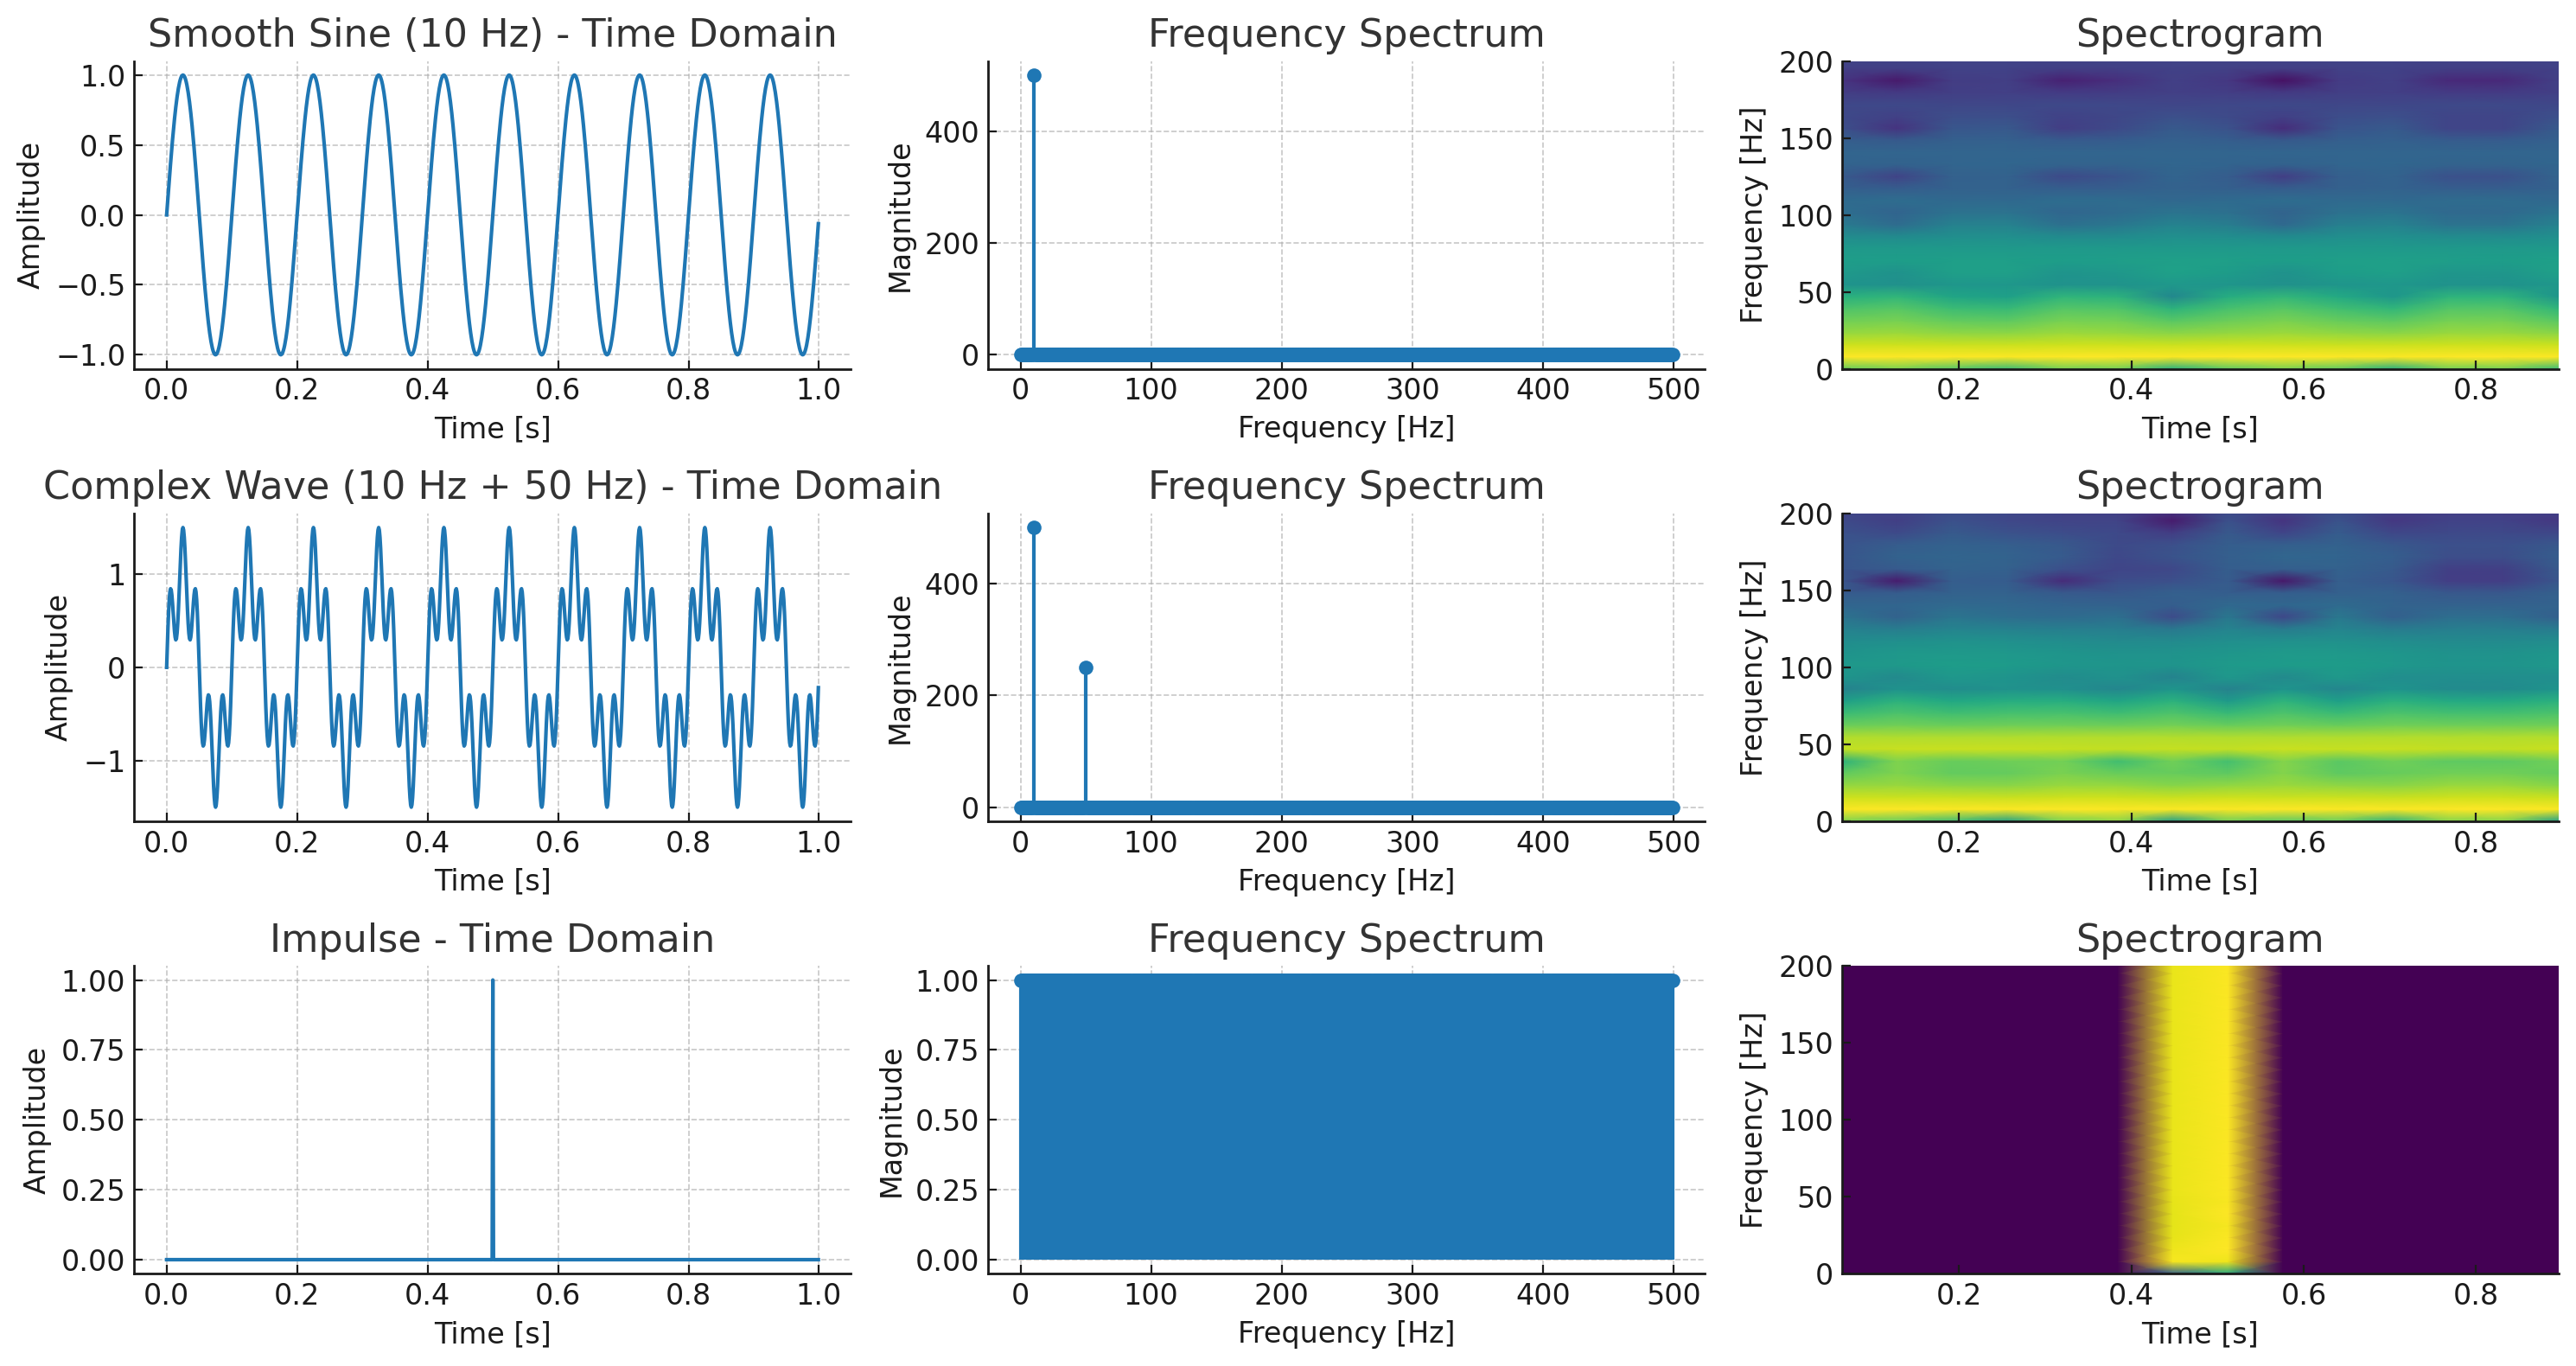
Each of the three rows here shows the same signal from three different perspectives:
Smooth sine wave (10 Hz)
- Spectrum: a single peak at 10 Hz → narrowband signal.
- Spectrogram: energy only around 10 Hz throughout, unchanged over time.
Slightly more complex waveform (10 Hz + 50 Hz)
- Spectrum: two distinct peaks → wider bandwidth than a single-frequency sine.
- Spectrogram: two horizontal bright lines (10 Hz and 50 Hz), present the whole time.
Impulse
- Spectrum: energy across almost the entire frequency range → wideband signal.
- Spectrogram: all frequencies light up only at the instant of the impulse, then disappear.
This intuitively illustrates the relationship between bandwidth and time-domain variation: the faster the change (the sharper the transient), the wider the spread in the frequency domain; the slower the change, the more concentrated the spectrum.
Translated from the Chinese original.